You already know what is Keras and to build a deep learning model using it. Instead of using TensorFlow directly you use Keras to build the model. But wait do you know you can also use the tools that are included in TensorFlow using Keras. Yes, it is. There is a tool in the TensorFlow that is Tensorboard that lets you visualize your model’s structure and monitor its training. In this entire intuition, you will learn how to view Tensorboard callbacks through Keras and do some analytics to improve your deep learning model.
How TensorBoard Create Visualization?
If you are using Keras for building the deep learning model .then by default kereas does not create log files. And Tensorboard uses log files for creating the visualization. Therefore for visualizing, you have to write some lines of code to your deep learning model. I have already created a model that you can read in my previous post. Just the extra work is to create a TensorFlow logger object (keras.callbacks).
Steps by Steps to View Tensorboard Callback
The complete code for the model, you will get in the Kera Deep Learning Tutorial post. I am continuing with that code. Just adding some lines of the code.
Step1: Create a logger Object
The first step is to create a logger object using the keras.callbacks.Tensorboard() method and pass the following parameters
log_dir = “log” for log directory, write_graph =True as by default Keras logs only training process, not the model, thus to allow logs for the model use it. histogram_freq=5 to know the statistics of how each layer is working. Here 5 means for each 5 passes it will log the statistics.
# TensorBoard Logger
logger = keras.callbacks.TensorBoard(
    log_dir="logs",
    write_graph=True,
    histogram_freq=5
)
Step 2: Add Logger to the model
After the creation of Tensorboard callback, you will now add the logger to the model.fit() method. The callbacks argument accept the list of the callback function. In this case, I have already created one Keras callback name is logger.
callbacks= [logger]. With it also put the validadation_data(x_test,y_test) argument inside the fit method.
# Train the model
model.fit(x=data
          , y=y
          , epochs=50
          , shuffle=True
          , verbose=2
          ,callbacks=[logger]
          ,validation_data=(test_x,test_y)
          )
Step 3: Run the Command to Visualize
Open Your Pycharm terminal or command prompt and type the command to allow the TensorFlow to build the logs files.
tensorboard --logdir “logs”After that you will get the localhost:6006 go to that URL and click on graphs to get the visual representation of the Tensorflow Computational Graph. Then you can see all the layers, input and output layer in the graph.

Other Things you can view in Tensorboard.
The above steps will allow you to visualize how the layers interact with each other for a single training process. What about if you want to run more than one training process and compare them. It can be done by using some tweaks in the code. You have to create two subversions of the logs files for each training process.
The first step is to define the variables that will create a folder with the string input of the variable name inside the log dir .
Lets the variable is TRAIN_PROCESS with the following details and run the code
For the 1st Run
TRAIN_PROCESS = “ Train with 50 Nodes”
And also change the log_dir with following code.
# TensorBoard Logger
logger = keras.callbacks.TensorBoard(
    log_dir=f'logs/{TRAIN_PROCESS}',
    write_graph=True,
    histogram_freq=5
)
For the 2nd Run
TRAIN_PROCESS = “ Train with 5 Nodes”
And edit the input layer with the 5 Nodes.
model.add(Dense(5, input_dim=7, activation="relu",name="input_layer"))In both the cases when you will run the code you will get the two folders inside the logs folder. Named “Train with 5 Nodes” and “Train with 50 Nodes”. Inside them, you will see logs for each of the training processes. Let’s view them in Tensorboard. Just type the following command in your terminal
tensorboard --logdir “logs”
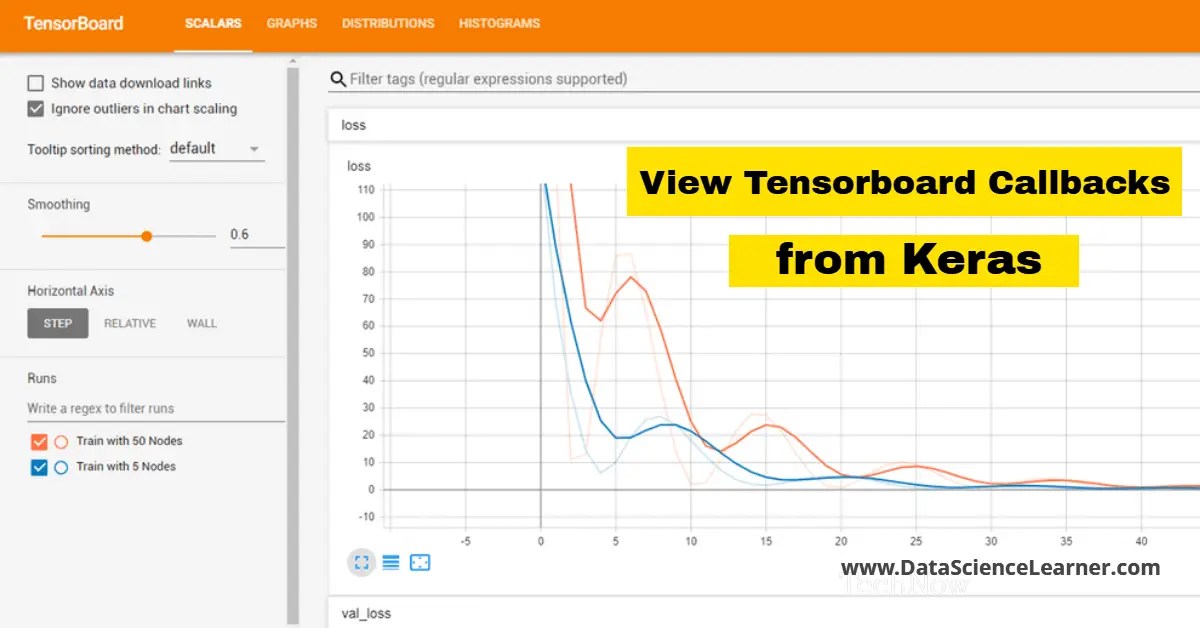
Go to your http://localhost:6006 and there when you click on scalars you will clearly see the current cost chart for the trained model. There are two lines for each training model.

The Y-axis denotes the current cost and X-axis is the number of training passes completed. You can also clearly see the lines are going down and it shows that our model is getting accurate as they trained. From the graph, you can also infer that Train with 5 nodes is faster than the train with 50 nodes for our example and It can vary with other examples
End Notes
Visualizing and tweaking the layers and training process improves accuracy. TensorFlow creates logs by default for analyzing but in the case of Keras you have to write some lines for it. If you want to see what Keras is doing inside then you can use callbacks for Tensorboard.
We hope you have understood these concepts. If you have any query then please contact us for answers and suggestions. In the meantime, you can like our page.

Join our list
Subscribe to our mailing list and get interesting stuff and updates to your email inbox.
