If you have a dataset then some values of a feature or column are in the high range and some are not. It leads to the wrong building of the prediction model. That’s why training and test data points should be normalized to perform correct predictions. In this entire tutorial, you will know how to normalize pandas data frame on column through step by step.
Steps to Normalize a Pandas Dataframe on Column
Step 1: Import all the necessary libraries
In my example, I am using NumPy, pandas, datetime, and sklearn python module. Let’s import them.
import numpy as np
import pandas as pd
import datetime
from sklearn import preprocessing
Step 2: Create a Pandas Dataframe
To do pandas normalize let’s create a sample pandas dataframe. Execute the below lines of code to create a dataframe.
todays_date = datetime.datetime.now().date()
index = pd.date_range(todays_date-datetime.timedelta(10), periods=10, freq='D')

columns = ['A','B', 'C']
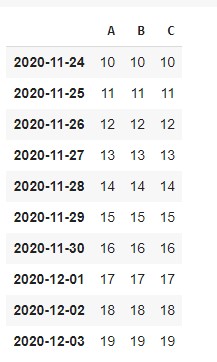
data = np.array([np.arange(10,20)]*3).T
df = pd.DataFrame(data,index=index, columns=columns)
Here I am creating a time-series dataframe with three columns. The output of the above code is below.
Output

Step 3: Use the following method to do Pandas Normalize on Columns
After creating a sample dataframe, now let’s normalize them. In this section, you will know various methods to normalize a pandas dataframe.
Method 1: Normalize data using sklearn
Sklearn is a popular python module for machine learning implementation. There is a method in preprocessing that normalizes pandas dataframe and it is MinMaxScaler(). Use the below lines of code to normalize dataframe.
from sklearn import preprocessing
min_max = preprocessing.MinMaxScaler()
scaled_df = min_max.fit_transform(df.values)
final_df = pd.DataFrame(scaled_df,columns=["A","B","C"])
Explanation of the code
Here First I am importing preprocessing from sklearn. Then I am creating a MinMaxScaler() object and fit the dataframe values. The method accepts only NumPy arrays so I am converting all the column values as NumPy arrays using df.values. Now you can convert it to dataframe (pd.Dataframe) and print the output then you will get the following.
Output

You can see in the above figure all the numerical column values are in the range of 0 to 1. It’s verification that dataframe has been normalized.
Method 2: Normalize data using Formulae
The above method was directly using the function MinMaxScaler(). But you can also use formulae to normalize pandas data frame. The formulae of it is below.

I am applying this formula to the whole dataframe. Run the code below.
normalized_df=(df-df.min())/(df.max()-df.min())Output

If you compare the above two methods then you will see the output is the same in both examples.
Other Examples
The above two methods were normalizing the whole data frame. It means all columns that were of numeric type. Suppose you want to normalize only a column then How you can do that? In this section, I will show you how to normalize a column in pandas.
Normalize a column in Pandas from 0 to 1
Let’s create a function that allows you to choose any one column and normalize it.
def normalize_column(values):
  min = np.min(values)
  max = np.max(values)
  norm = (values - min)/(max-min)
  return(pd.DataFrame(norm))
Now I can use this function on any column to normalize them. For example, I want to normalize the A and B columns separately then I will just call the function with df[“A”] and df[ “B” ] as an argument. Just run the code below.
normalize_column(df["A"])Output

normalize_column(df["B"])Output

Conclusion
Normalizing data is a must for making a good predictive model. These are the methods I have compiled for you to do pandas normalize on a single column or the whole dataframe. Hope you have understood how to normalize columns in pandas. If you have any queries then you can contact us for more information.
Source:

Join our list
Subscribe to our mailing list and get interesting stuff and updates to your email inbox.


